
The Bottom of the Barrel
The Bottom of the Barrel
Bullish inflection confirmed?


Since my initial analysis, proceeding May’s corporate earnings period, which argued that a technical recession is imminent, markets proved me correct and shed considerable value. The downturn was accompanied by two quarters of contractions in US GDP—essentially playing out a textbook technical recession scenario.
Once again, the key in correctly predicting the direction of markets revolves around central macroeconomic, fundamental, and technical catalysts. Macroeconomic catalysts include PMI readings and expectations, economists’ outlook, Fed policy, and several other consumer driven indicators. On the fundamental catalysts, the ongoing Q2 corporate earnings calls offer insightful commentary and guidance, in combination with equities’ current valuations on an absolute basis, and relative to their historic data. Technical catalysts primarily focus on assessing the strength of the main bearish trend, and then analysing the strength of the recent reversal—aiming to understand if a shift of the main trend is probable. In combination, all these catalysts drive market movements and, thus, their understanding is valuable for investors that are assessing and planning their next investment steps.
Last time around, a bearish alignment of these factors led to my successful forecast that a technical recession was imminent and unavoidable as the Fed was raising rates—ending the era of extravagant spending driven by rates near zero. And now, as the scenario of a technical recession is in full effect, the question is whether it will proceed to become an actual, 36 month long, recession?
The Macro Catalysts
FED interest rate hikes…
On July 27th, the federal reserve hiked rates by 75bps taking the benchmark rate to a range of 2.0-2.25%. Following the rate meeting, the Fed’s Chair, Jerome Powell, in his statement insinuated that as monetary policy tightens, larger rate hikes will be taken off the table, but offered no specific time frame. Thus, leaving the doors open for further 75bps or even 100bps rate hike, depending on the data.
The very next day, the release of highly anticipate preliminary GDP data was quite pessimistic recording a 90bps contraction (vs. expected 50bps). Additionally, the recent Chicago PMI reading came in below expectations at 52.1 (vs. expectations of 55).

The headline PMI index has been falling for over a year, with the most recent reading still in expansionary territory, but missed expectations considerably. During a mid/late cycle slowdown, this is about where the index would stop descending with the S&P 500 trading right where it should be based on the expected PMI.

Economists remain on the fence, with almost half expecting a US recession, as financial analysts argue economic strength is both a blessing and a curse. Of course, GDP contractions and worsening economic conditions are an unpleasant and difficult experience. However, the Fed is looking for signs of economic strength in order to hike rates even further in an attempt to reign in on inflation growth.
As of now, it appears our economic reality is going through a transformative period, experiencing deterioration of some key macro indicators (both lagging and forward-looking). Based on the data, although the economy remains healthy, the Fed’s strategy is equally likely to induce a soft landing or a disastrous crash.
Consumer Sentiment…
Since April, multiple surveys have highlighted waning consumer sentiment, and mildly contracting economic activity following a period of prolonged, though in part artificially driven, prosperity.

The Fed’s approach is to continuously adapt based on the data. Unfortunately, we can but assume the level of economic deterioration Powell expects to see in order to reduce rate hikes. Looking at JPM’s chart it’s clear that, as of June, consumer sentiment has reached a bearish extreme, indicating there’s high probability of market growth in the subsequent 12 months.
Revered strategist, Ed Yardeni, recently called a bottom on the S&P500, saying he doesn’t expect the Fed to hike interest rates above 3.25%, adding that;
“I think what has to be factored in is quantitative tightening, which means the reduction in the Fed’s balance sheet, has a tightening impact, accounting of at least 50bps, [and] there’s a strong dollar, which also accounts for around 50bps”
Payrolls & Job Growth…
Expectations of a slowing economy meant job growth was also forecasted to weaken considerably. June’s U.S. nonfarm payrolls, measuring the change in the number of people employed, was forecasted at 250K, with the actual number coming in at 528K (~110% above expectations and ~33% MoM). The new payroll data got me into deep thought and delayed the publishing of this article by a couple of weeks. It was important to understand how the considerable beat of payroll expectations would ultimately impact the chances of a FED induced soft-landing.
Arguably, if hiring remains resilient, then personal consumption expenditures, which account for ~70% of GDP, would continue supporting a financial recovery. Both the Biden administration, and the Fed’s chairman Jerome Powell, argued against the notion that two quarters of contracting GDP signals a recession. Powell said that interest rates could jump even higher, in a bid to temper rising inflation, without impacting the real economy.
The verdict on the macro environment is neutral as the impact of the aforementioned catalysts is highly ambiguous. In theory, economic deterioration could lead to various scenarios. Despite the ambiguity of the fundamentals, there’s high probability of equity markets having reached a bottom and especially certain sectors (i.e., high margin tech companies) that may well disconnect considerably from any further deterioration of the real economy.
The Fundamental Catalysts
The fundamentals are quite insightful, especially during peaks and troughs in valuations, making it easier to understand what constitutes an imbalance in the market. Inspecting the current data presents a dilemma: either we’re heading towards a very disastrous and long-term recession (a black-swan event), or the downtrend has bottomed, and the ongoing bullish reversal will replace the main downtrend (see both scenarios below).

It’s interesting to note that more equities are trading below their cash and short-term investments than during the 2000’s tech bubble and the global financial crisis of FY’08-09 (see below).
Historically speaking, today’s inflation driven bear market is unlikely to significantly surpass the duration and magnitude of the crises mentioned, therefore a risk-oriented contrarian investor probably views this extreme as an opportunity to capitulate on the probabilities of a durable trend reversal.

EPS growth reduction priced-in?...
In previous weeks, the rally generated significant returns for buyers, a rally initiated from the Tech sector which broadened by mid-week (29-25 /08).
Nonetheless, there’s several investment professionals actively warning the recent rally is a bull-trap. A strong advocate of the bear market rally camp and Morgan Stanley’s CIO, Mike Wilson, wrote recently
“convicted in our view that bottoms up NTM S&P500 earnings estimates are too high and have meaningful (i.e., >10%) downside from the recent peak of $240.”
Adding that,
“So far, EPS forecasts have only dropped by 0.5% making it difficult for us to agree with the view the market has already priced it.”
However, as Mike Wilson was expecting earnings growth to significantly reduce following demand tightening, Q2 2022 results have been unexpectedly positive. Thus far, 56% of S&P 500 companies have reported, with 73% of these companies reporting a positive EPS surprise, and 66% reporting a positive revenue surprise. Blended earnings growth for the quarter was 6%, marking the lowest earnings growth rate reported, for the S&P 500, since Q4 2022 (~4%).
It's surprising that so many companies beat analysts’ consensus expectations that hadn’t been trimmed down meaningfully to account for the emergence of significant global uncertainties in FY’22. The current quarter (Q2) marks the first time, since the Fed’s rate hikes, and the war in Ukraine, that analysts initiated the process of tempering future expectations.
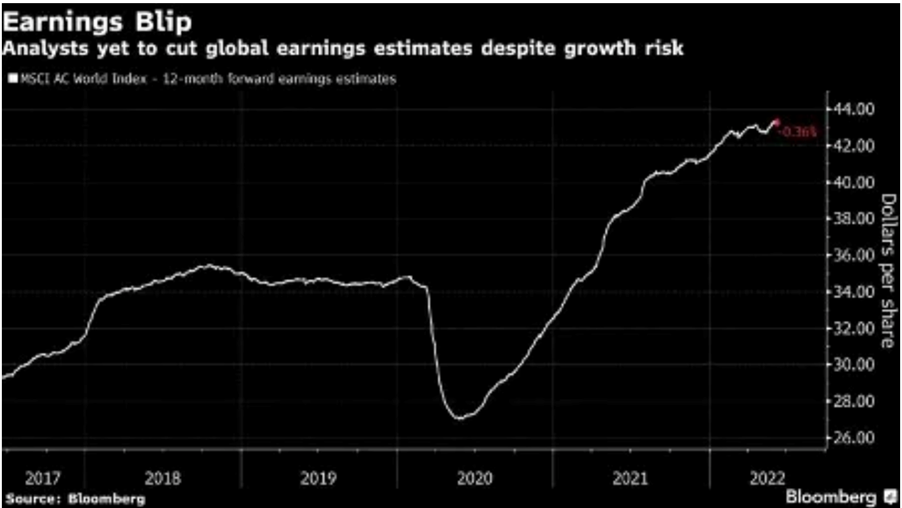
According to Factset, during July analysts lowered EPS estimates for Q3, the bottom-up EPS estimate (an aggregation of the median EPS estimates for all companies in the index) decreased 2.5%, a small reduction on original growth expectations of ~10% YoY.

Challenging Wilson’s common-held hypothesis, that markets haven’t priced-in lower EPS expectations, global growth optimism (see above) hit an all-time low, indicating that despite analysts’ delay in updating corporate profit expectations, investor pessimism has gone significantly below the street’s updated consensus forecasts.
Backing the bullish camp, JPM’s well-known equity strategist, Marko Kolanovic, is one of only a few bulls amongst top strategists in US banks. He posits that much of the bad news is priced in and that US markets will end the year “meaningfully higher” on attractive valuations, as the peak in investor bearishness has likely passed. In addition, short positioning data fully supports a sustained recovery (at least) in the short-term.
As Citi’s strategist Chris Montagu said, short positions across most markets are facing steep losses after last week’s rally (see below), increasing the risk of a short squeeze and equity upside from forced unwinds of large legacy shorts.

Thus, the verdict on the fundamental’s is bullish as concluded by analyzing the aforementioned fundamental data. Counterintuitively, mounting data of extremely bearish expectations, more often than not, indicates the bottom of the barrel is nearby. Corporate earnings calls are only followed by modest reductions in EPS and revenue growth for FY’22, thus showing the worse is probably already priced in.
The Technical Catalysts
The technical catalysts are, in general, simpler to analyze as they exhibit clear direction, or lack thereof. However, some directional ambiguity does arise when analyzing different timeframes, and business sectors of the market.
The short-term technical picture…
Starting with the S&P 500 (SPX), price action (see below) is exhibiting signs of new trend formation. The preferred volume driven indicator OBV (on-balance volume), is for the first time, since April 6th, trending above the 30-day moving average. However, the recent breakout isn’t conclusively supported by higher volume, as price moves higher, volume appears to have slightly diverged—failing to follow price action in the past few days.
Additionally, daily RSI and MACD readings indicate over-extension of the uptrend, exhibiting a high probability of short-term downside (aka pullback). As the directional ADX indicator is exhibiting bullish tendencies, as a new trend appears to have formed.
In an otherwise established trend, a short-term pullback is nothing to worry about. However, in the current environment, near a probable inflection point, the first pullback is crucial and should be closely monitored. Any signs of an aggressive reduction in market value (lower lows), or a sideways consolidation spanning more than a couple of weeks (range), signal the pullback is in jeopardy of transforming into a range or a continuation of the already established downtrend.

Moving on, Nasdaq’s price action will be assessed via the QQQ ETF (see below) for better volume analysis. Purely based on short-term technical signals, the upswing in technology stocks appears a stronger candidate, relative to the S&P 500, to complete a full confirmation of the bullish reversal, ultimately leading to a strong uptrend.

The OBV is trending above its 30-day average for several consecutive weeks—highlighting a more established trend relative to the SPX. Despite volume trending in tandem with QQQ’s valuation, there’s clearly a reduction in overall interest as measured historically by the OBV (see below).
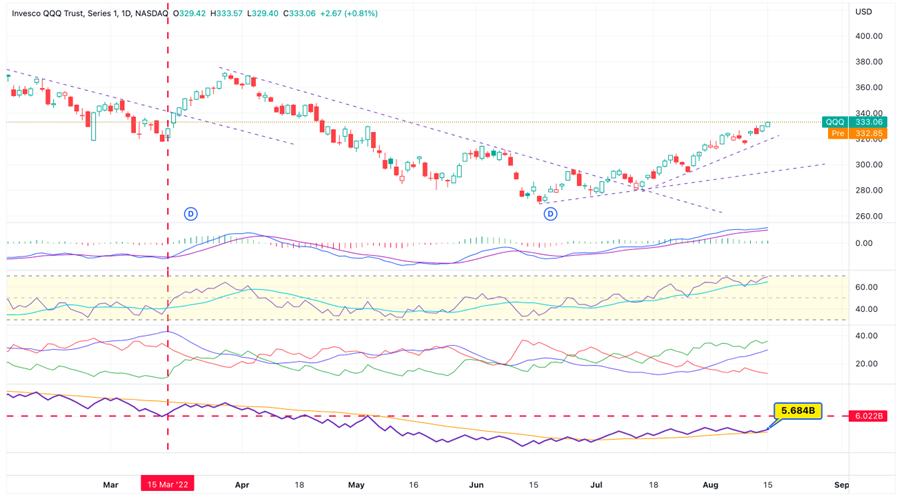
Comparing today’s price relative to March 15th (note vertical red line above), the technical perspective somewhat shifts. Although QQQ now trades above March prices, OBV remains ~6% below 15/03. The divergence is currently inconsequential, but should be monitored incase of further widening of the divergence which indicates over-extension.
The long-term technical picture…
Analyzing the weekly timeframe provides a longer-term perspective on price action. As highlighted on the weekly SPX chart (see below), this week’s price action is testing the second, and last, downtrend resistance. If weekly price above the downtrend line, with good momentum on the daily timeframe, then the bullish breakout confirmation is valid.

On a different note, the technology driven QQQ has already confirmed a breakout from its long-term bearish channel. What’s more, the tech sector’s upside is greater than the overall market, with a technical target of $370 (+11% above current price) appearing plausible based on QQQ’s recent price action.

The verdict based on the technical catalysts is bullish, with the preferred investment strategy focusing on technology first and the overall market later. Technology stocks are notoriously high beta, and on this occasion their asymmetrically attractive risk-reward ratio means the NDX is a preferable investment relative to the SPX or DJI.
Synopsis
Having completed an analysis and assessment of all key catalysts, the overall conclusion is bullish. Last time around, my article arguing a technical recession was imminent recorded conclusive bearish readings of all key catalysts. This time, the bottom is harder to call with only 2/3 of our catalysts converging bullishly, due to an ambiguous neutral verdict regarding macroeconomic indicators.
Essentially, the current environment remains highly attractive for investors looking to capitulate on a asymmetric risk-reward Technology trade, going against the main downtrend, thus facing superior returns (and risk) relative to investors waiting for a conclusive bullish reversal across all major indices.
The key is strategically entering the market by first monitoring the near-term exhaustion discussed earlier (in the technical section). Wait patiently for the first pullback following the breakout, and position any buy entries only if the bullish trend reversal remains intact as the pullback fades.
Sources: Financial Times, Investing.com, CFTC, Bloomberg, BOFA, FactSet, Ned Davis Research, JPM Asset Management, Yardeni.com.
Disclaimer: The views and opinions expressed in this article are solely the author’s. No information in this article should be interpreted as investment advice. ‘Market Mind’ encourages all users to do their own research before investing in the stock market.